- Summary of Ann Arbor Deer Management Program
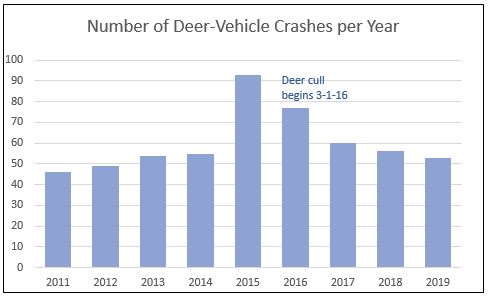
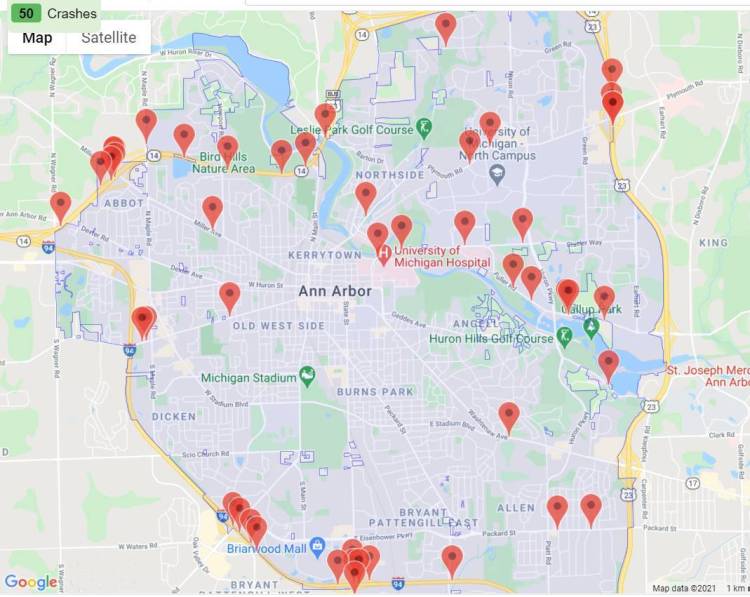
- Deer-Vehicle Collisions Annual Crash Numbers for 2011-2019 and 2019 DVC map
- Highlights from White Buffalo’s Year 4 report to the City
- Deer Abundance by Area
- Future Management Considerations
Link to the City of Ann Arbor’s Deer Management Site.
The City of Ann Arbor has also developed the Ann Arbor Deer Data Tool. This GIS tool can overlay a map of Ann Arbor with the aerial deer counts, the deer vehicle crashes, and other data.
Summary of the accomplishments of the Ann Arbor deer management program, by WC4EB.
The Ann Arbor Deer Management Program, 2016-2020, is a success by many standards.
- Reduced the City’s deer population by 53%
- Distributed 13,000+ pounds of venison to food pantries
- Reduced deer/vehicle collisions by 45% from 90 (2015) to 50 (2019)
- Lowered the annual program budget $260,000 to $120,000
The goal is not to reduce Ann Arbor’s deer herd to zero (which is unattainable). The long-term goals include:
- to reduce deer-vehicle collisions to less than 40 a year
- to reduce deer browse damage in natural areas so the ecosystems can regenerate, increase biodiversity, and sequester more carbon.
Last spring, Council suspended the FY 2020-21 deer program due to the pandemic. Deer herds double every two years. Forgoing the program for a second year will undo much of the progress attained in the first five years.
We urge the City to resume deer management, that includes:
- Monitor vegetation damage from deer in our parks
- Track the number and location of city deer with aerial surveys
- Educate the public about the reasons and benefits of deer management
- Cull deer safely in city parks with experienced sharpshooters to reduce and stabilize the deer population
Deer-Vehicle Collisions in the City of Ann Arbor
from https://www.michigantrafficcrashfacts.org/
Deer-vehicle collisions (DVCs) have decreased steadily since deer culling has started in Ann Arbor. They have decreased from an high of 90 in 2015 to 50 in 2019 (the last year of data currently available).
Highlights from White Buffalo report
Below are the highlights from latest summary report from White Buffalo, Inc about Ann Arbor’s deer management activities. The full report is available – The Year Four Summary Report by Dr. Anthony J. DeNicola, White Buffalo, May 26, 2020.
Ann Arbor is a challenging situation for deer managers. The City is nearly built out, and the predominant development pattern is single-family homes surrounded by wooded corridors with no hunting and no non-human predators. This development pattern creates excellent deer habitat. The directive set by the City included improving forest health/regeneration in natural areas, a reduction in deer-vehicle collisions (DVCs), achieving a 75% satisfaction level among residents, and gathering data to inform future management decisions. The primary objective in Year 4 (2019/2020) was to assess the complementary effect of lethal management in larger wooded areas proximate to sterilization efforts that occurred in dense suburban neighborhoods.
While sterilization efforts were conducted during the first three years of the program, no sterilization efforts were conducted as part of the efforts in Year 4 due to permit restrictions.
In Year 4, sharpshooting activities occurred from 2 – 22 January 2020 at 18 sites, and 109 deer were culled.
A helicopter survey was conducted on 21 January 2020 using the same methods as in Year 3, however in addition to Wards 1 and 2, Wards 3, 4, and 5 were flown comprehensively. The survey detected 214 deer (137 in City limits), compared to 298 (224 in City limits) in Year 3, and 315 (289 in City limits) in Year 1. This is a 53% population reduction, using direct counts, within City limits from Year 1. As in previous years, we used a correction factor to account for the detection rate of individual deer in various environments. After applying this correction factor, we determined there were ~145 deer in Wards 1 and 2, 69 of which were in the sterilization study areas (South Study Area: 50, North Study Area: 6, East Study Area: 13). There were ~13 deer/mile2 on average (145 deer in ~11.1 mile2) in Wards 1 and 2. In areas with good sharpshooting access outside of the sterilization study sites, there were ~11 deer/mile2 remaining (~76 deer in ~7 mile2). Given the ~38 untreated adult females in Wards 1 and 2, we expect an additional ~42 fawns to be recruited into the population, raising the total to about 187 individuals by fall 2020. This level of recruitment will result in ~17 deer/mile2.
Camera surveys were used to estimate the number of deer in the SSA after culling operations. An estimated population in the SSA was determined to be ~50 deer (~31 deer per mile2), with ~88% of the adult females sterilized. Aligned with the total population reduction, the doe:fawn ratio has declined from 1.1 (2017) to 0.15 (2018) to 0.11 (2019) and remained at 0.11 in 2020.
On 13 December 2018, the Michigan House of Representatives passed a bill that prohibits the Michigan Department of Natural Resources from issuing deer sterilization permits until 2022. This bill removes the option for additional non-lethal deer management in Ann Arbor. With no adequate lethal management sites in the SSA and minimal home range overlap with adjoining sharpshooting areas (e.g., Arboretum and HPNA), without sterilization as a tool, we would have had no impact in the SSA, and the population would have likely increased from the Year 1 baseline. If surgical sterilization is not permitted in the immediate future, the local deer population in the SSA will increase negating the significant reduction accomplished over the past four years.
In summary, over four years we have demonstrated a 47% reduction in the SSA (94 deer in 2017, 63 in 2018, 46 in 2019, 50 in 2020) and a 60% reduction in the NSA (15, 10, 12, 6) with no deer mortality or human safety issues. In addition, we have documented a 58% reduction in deer abundance in Wards 1 and 2 outside of the southern and northern surgical sterilization areas. Of importance to note, we observed similar population impacts with lethal and non-lethal methods, and the surgical sterilization areas would have received negligible population impacts from a “sharpshooting only” program. Therefore, program success was the result of using combined methods.
Deer Abundance by Area, Table 4 on Page 12
Table 4. Deer abundance determined during the helicopter survey, within delineated zones in Wards 1 and 2, with an incorporated correction factor (CF).
| Area | # Deer x CF = Total | Deer/mile2 |
| Northwest Neighborhood – Skyline (west of river) | 16 X 80% CF = 19 | 1.2 mile2 = 16 deer/mile2 |
| South of River – Huron Parkway NA | 6 X 80% CF = 7 | 0.5 mile2 = 14 deer/mile2 |
| North and East of River | 47 X 80% CF = 57 | 5.8 mile2 = 10 deer/mile2 |
| ESA | 11 X 80% CF = 13 | 0.8 mile2 = 17 deer/mile2 |
| NSA | ~6 (Helicopter and field observations) | 1.2 mile2 = 5 deer/mile2 |
| SSA | Camera survey = —50 | 1.6 mile2 = 31 deer/mile2 |
Future Management Considerations, from pages 21-22
After completion of the four-year research project, there are a few key insights to help direct local deer management moving forward. We have successfully impacted most areas of Wards 1 and 2 by combining sharpshooting and surgical sterilization methods. However, the area adjacent to Skyline High School in the NW neighborhoods continues to be a focal challenge. High deer densities in the Township abutting the municipal line and lack of access to shooting locations near the school have resulted in modest impacts from deer management activities in this area. The two residents who volunteered their properties last year saw a dramatic decrease in the number of deer they observed between the end of Year 3 and the beginning of Year 4. The localized impact is substantial, but on a broader scale, we need to find additional access points in this area. We are near maintenance level densities (i.e., management objectives are being met) in the rest of Wards 1 and 2, with pockets of deer in Wards 3, 4, and 5 that should be addressed before densities increase to problematic levels. For example, Natural Areas Preservation received complaints from residents in Wards 3 and 5 expressing concerns regarding numerous deer in and around their neighborhoods. The concern in Ward 3 was centered around Scarlett Woods and Pittsview Drive/Charing Cross, whereas many as 11 deer in one herd have been observed. The complaint from Ward 5 noted ten deer in the area south of M14, west of Main Street, north of Miller Avenue, and east of Newport Road.
Moving forward in the SSA, if surgical sterilization is not permitted next year (i.e., winter 2020-21), then non-traditional lethal management could be considered for the remaining non-sterilized deer. If the remaining non-sterilized females are allowed to reproduce, in a matter of 2-3 years, the deer population will grow nearing pre-research levels. Options could include, but not be limited to, capture and euthanasia. The two most common mechanisms utilized for this approach are dart and euthanize,and drop-net and euthanize. Both options have pitfalls. With the use of drop-netting, previously sterilized deer may be captured and subjected to the stress of capture and release (if it is decided not to euthanize them as well). With dart and euthanasia, although you can target specific untreated females, the meat cannot be donated for consumption and must be disposed of because the animals are exposed to capture drugs.
Additional information on Ann Arbor’s Deer Management Program
- Deer Management in Ann Arbor 2014-2020, presentation by Dave Borneman (PDF)
- Our Deer – Margaret Leary, Ann Arbor Observer, Jan 2012
- Our Deer are mostly Ann Arborites – Margaret Leary, Ann Arbor Observer, Feb 2015
- A divergence in values – Margaret Leary, The Ann, Feb 2016
- Chronology of a Deer Cull – Margaret Leary, The Ann, Feb 2016
- HSHV spreads false information about A2 deer – Margaret Leary, The Ann, Feb 2017
- Local in Ann Arbor – Vivienne Armentrout’s blogs on deer management 2014-16
